Please note that the following is a preliminary write-up of the investigation into the Whitsbury Parish sheets, and as such some of the information contained therein may be provisional or inaccurate.
Introduction
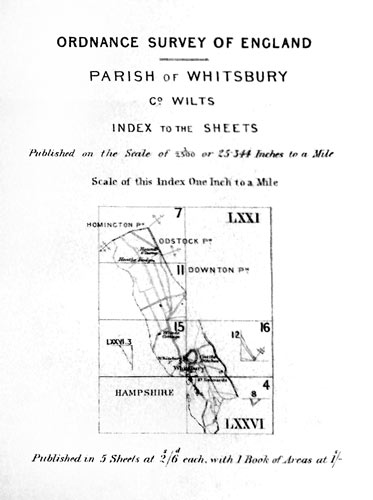
Figure 1
Index to the 1:2500 maps of Whitsbury Parish, 1871
In 1871 the parish of Whitsbury - at that time in Wiltshire - was surveyed at 1:2500 scale by the Ordnance Survey. Five sheets covering the parish were produced (insets appear on three of the sheets). (Figure 1).
However these sheets are on different sheet lines and obviously constructed on a different projection origin to those of the rest of the county published from 1873 onwards - the sheet lines and sheet numbers do not match.
There is no indication on the Whitsbury sheets as to their construction; indeed no graticule markings are to be found - as is common for 1:2500 first editions.
The projection origin for the later sheets of Wiltshire is Dunnose on the Isle of Wight, which served as the origin for several of the counties in the south of England and the Midlands[1].
So there are at least three questions to be answered:
1. Where exactly was the projection origin used for the early Whitsbury sheets?
2. Can we find or compute the parameters used to construct their sheet lines?
3. Why was the original projection origin abandoned in favour of Dunnose?
A new angle: Finding the origin
Careful measurements were taken from four of the original Whitsbury Parish maps - and some of their contemporary Hampshire (Dunnose origin) neighbours - in the Bodleian Library on 2 March 2010.
Upon returning home with copious notes and figures taken from the maps an initial calculation of angular difference between features on the Whitsbury and the Hampshire sheets was carried out, giving approximately ½° difference.
Given the several county origins coinciding with points used in the Principal Triangulation[2], the point of origin for the Whitsbury sheets could well have been such a station. Roger Hellyer kindly furnished me with a copy of some of the early work of the Principal Triangulation relevant to the area[3]. From this and other triangulation information, calculations were undertaken of the depiction of the features using different projection origins in the region of ½° west of Dunnose, including Salisbury Cathedral, Beacon Hill, St Mary’s Church Marlborough, Thorney Down and others.
It soon became clear, however, that these origins did not quite satisfy the observed angular difference between features, the residual amount being in the region of 0.15°. Further investigation revealed that the angular difference between features on sheets with differing projection origins does not equate exactly to the longitudinal difference between those origins - this being the result of distortion caused by the Cassini projection.
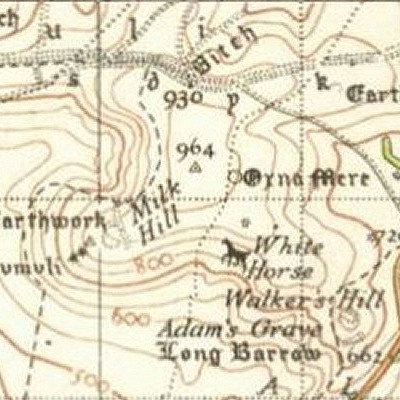
Figure 2
Extract from 1-inch New Popular Edition sheet 167
The exact position of the Milk Hill triangulation point has been lost on modern mapping and it does not appear in Ordnance Survey’s online database of trig points. Given that the land upon which it stood is cultivated, a physical search would be extremely difficult. The position used for inital calculation, therefore, was derived from its depiction on a 1950s 1-inch New Popular Edition map of the area which shows the trig station (Figure 2), and limited refinement from features measured on the original maps.
Co-ordinates used for initial calculations [Datum OSGBI 1858]:
51° 22' 32.97" North, 1° 50' 58.15" West
Sheet lines of 'home sheet': West s/l = 16,900ft W of origin, South s/l = 0ft N/S of origin
Getting the measure of it: Wiltshire’s county top
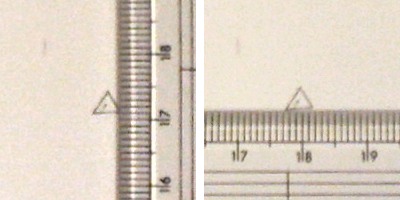
Figure 3
Measurements of Milk Hill taken from Wiltshire sheet XXXV.6
Using the Dunnose origin as given by Brian Adams (50° 37' 3.748" N, 1° 11' 50.136" W)[2] to calculate the co-ordinates of its measured position, it was instantly clear that the Milk Hill triangulation station was in fact in the region of 20-28ft west of my initial estimate and approximately 8ft further south.
Measurements from the original maps are, by their nature, approximate affairs. Paper shrinkage, warping and original surveying and plotting inaccuracies can all conspire to confound the forensic cartographic mathematician.
Further measurements were taken from the entire set of Whitsbury sheets and further calculations were undertaken while referring to the maps concerned. The difference between the estimated and measured position of Milk Hill meant that the initially-estimated sheet lines had to be moved 20 feet east relative to the origin - maintaining round numbers for sheet line co-ordinates consistent with most other counties. The latitudinal difference of approx. 8ft was ignored largely for the fact that this equates to less than one millimetre (approx. 0.038") on the maps and could easily have been the result of any of the distortions mentioned above. Additionally because I was calculating co-ordinates as if they were in the OSGB36 datum - there being no published transformation from OSGBI 1858 - an additional distortion of a small but unknown quantity was inevitable.
Still further measurements of other features were used to ascertain the accuracy of the adjusted origin and sheet lines, the result being co-ordinates believed to be accurate to ±5ft with respect to OSGBI 1858, but it was clear that further investigation was required to ascertain a more exact position.
Co-ordinates derived from measurement (14 March 2010):
51° 22' 32.89" North, 1° 50' 58.56" West
Expected error margin: ±5ft N/S, ±5ft E/W
Sheet lines of 'home sheet': East s/l = 14,800ft E of origin, South s/l = 0ft N/S of origin
Clarke’s marks: The Principal Triangulation
By the kindness of Anne Taylor at the Cambridge University Map Library I was supplied with photocopies of a few pertinent pages of the 1858 publication Account of the Observations and Calculations, of the Principal Triangulation... by A R Clarke[6]. This publication describes the triangulation station at Milk Hill as having been established and first observed in 1850, and being:
"A coarse stone, with a small hole in its centre, is placed 2 feet below the ordinary surface, to denote the precise spot from which the observations were made."
The 1858 publication contains from pages 723-727 a list of stations of the Principal Triangulation with latitudes and longitudes. However these are not OSGBI 1858 co-ordinates because they are not based on Airy’s ellipsoid. They are in fact the result of additional calculations by Clarke to determine a new ellipsoid (Clarke 1858) using adjusments from astronomical observations[7]. The co-ordinates are in a datum which was never adopted for Ordnance Survey maps of Great Britain and Ireland.
Nevertheless with no further information at the time my mathematical mind could not help but want to derive a method of co-ordinate transformation to find from this list a position for the Milk Hill triangulation station in OSGBI 1858. Without any details of the exact parameters used by Clarke to arrive at his values I derived a 3-dimensional linear regression based on nine coincident points in England and Wales of the Principal Triangulation and the County Series origins given by Brian Adams, excluding Danbury Church Spire (value obviously misprinted in Clarke’s list) and York Minster (a statistical outlier for reasons which became clearer later on).
The regression I derived produced the following co-ordinates for Milk Hill:
Co-ordinates derived from interpolation (23 March 2012):
51° 22' 32.878" North, 1° 50' 58.497" West
Expected error margin: ±1ft N/S, ±2ft E/W
Sheet lines of 'home sheet': East s/l = 14,800ft E of origin, South s/l = 0ft N/S of origin
It was not until some time later that I located the full text of the 1858 publication in the Google Books online library[8]. This allowed me to discover that Clarke had in fact listed co-ordinates on pages 677-684 of some - but not all - the stations of the Principal Triangulation based purely on Airy’s ellipsoid and the adjusted triangulation observations. These are therefore OSGBI 1858 co-ordinates however Milk Hill is not one of those in the list!
Thaddeus Vincenty to the rescue
In the absence of any further co-ordinates in the OSGBI 1858 datum at the time, I set about calculating the position of Milk Hill manually from the observed and corrected angles and distances of the triangles given by Clarke.
Figure 4
Adapted extract from the diagram of the Principal Triangulation stations
 Principal Triangulation station Principal Triangulation station |
 Primary calculation ray Primary calculation ray |
 Triangulation station name Triangulation station name |
 Secondary calculation ray Secondary calculation ray |
 Block(s) in which station calculated Block(s) in which station calculated |
 Tertiary calculation ray Tertiary calculation ray |
 Quaternary calculation ray Quaternary calculation ray |
The Principal Triangulation was divided into ‘figures’ or ‘blocks’ to allow the calculation and adjustment of the triangulation to be carried out in smaller chunks. Milk Hill is contained within Block 14, and was only observed from those stations within its own Block. Thus to start the process of finding its triangulated position, we must work back from a known point using the adjusted triangulation data to a point in Block 14. This can be done in one of many ways (Figure 4); indeed calculation via a number of routes is advisable to ensure the veracity of the network.
Greenwich Observatory is given by Clarke on page 672 as being at 51° 28' 38.30" N and 0° E. Knowing this and the distance and bearing to another station we can compute its position. Pages 677-684 of Clarke’s book give us the positions so computed of Leith Hill Tower, Butser, Beacon Hill, Dunnose and Whitehorse Hill, among many others not relevant to the calculation of Milk Hill.
Working through the formulae given on page 676 by Clarke I was able to compute longitudes which agreed with his results, however I was unable to make the formulae for latitude work correctly. Thus I searched for another method of calculating new positions from distance and azimuth and came across the work of a mathematician named Thaddeus Vincenty whose ‘direct formulae’[9] fitted the bill.
I have omitted the method and most of the intermediate stages of the calculations used but the following are the weighted average positions of the stations I calculated to ascertain the position of Milk Hill:
| Latitude | Longitude | |
| Leith Hill | 51° 10' 32.88695" | -0° 22' 11.04901" |
| Butser | 50° 58' 38.23344" | -0° 58' 43.77986" |
| Whitehorse Hill | 51° 34' 29.85543" | -1° 33' 57.03849" |
| Dunnose | 50° 37' 3.74825" | -1° 11' 50.13645" |
| Inkpen Beacon | 51° 21' 7.08154" | -1° 27' 49.15717" |
| Mendip | 51° 13' 4.86387" | -2° 32' 36.53985" |
| Dean Hill | 51° 1' 48.11377" | -1° 39' 6.25299" |
| Beacon Hill | 51° 10' 59.23308" | -1° 43' 15.50651" |
| Wingreen | 50° 59' 4.74011" | -2° 6' 24.73421" |
| Westbury Down | 51° 15' 34.99444" | -2° 8' 31.60494" |
| Stoke Hill | 51° 16' 17.23684" | -2° 3' 41.54623" |
| Upcot Down | 51° 28' 42.78492" | -1° 48' 21.66845" |
Figure 5
Stations of Triangle 14 of the Principal Triangulation
Therefore the following are the calculated positions of Milk Hill using Vincenty’s direct formula, Clarke’s data of observed/corrected angles and distances, and my own calculations of intermediate stations:
| Clarke’s data [1858] | Milk Hill position [EJF 2012] | ||||
| From | Dist. (ft.) | Ref. | Bearing | Latitude | Longitude |
| Dean Hill | 134098.9014 | t12, p466 | -19° 41' 40.56013" | 51° 22' 32.87410" | -1° 50' 58.50128" |
| Beacon Hill | 76235.3608 | t8, p466 | -22° 39' 54.68117" | 51° 22' 32.87412" | -1° 50' 58.50131" |
| Stoke Hill | 61641.2391 | t26 p467 | +51° 45' 38.22166" | 51° 22' 32.87411" | -1° 50' 58.50131" |
| Westbury Down | 79189.0878 | t31 p468 | +57° 32' 33.51122" | 51° 22' 32.87412" | -1° 50' 58.50128" |
| Upcot Down | 38797.8393 | t14 p466 | -165° 8' 18.54290" | 51° 22' 32.87412" | -1° 50' 58.50129" |
| Mendip | 168891.8683 | t22 p470 | +69° 47' 38.63181" | 51° 22' 32.87412" | -1° 50' 58.50128" |
The results show an excellent degree of agreement and allow calculation of a weighted average position of Milk Hill:
| Latitude | Longitude | |
| Milk Hill | 51° 22' 32.87411" | -1° 50' 58.50129" |
Co-ordinates derived from triangulation data (3 April 2012):
51° 22' 32.874" North, 1° 50' 58.501" West
Expected error margin: ±1.2in N/S, ±0.8in E/W
Sheet lines of 'home sheet': East s/l = 14,800ft E of origin, South s/l = 0ft N/S of origin
A Wolff in sheets disclosing: Calculations confirmed
In April 2012, I acquired at considerable expense a hard copy of both volumes of The History of the Retriangulation of Great Britain in order to investigate the relationship between the Principal Triangulation (which yielded the OSGBI 1858 datum) and the Retriangulation (which did the same for OSGB36). Reading that and, subsequently, A History of the Ordnance Survey[7] I came across references to a 1919 publication The Mathematical Basis of the Ordnance Maps of the United Kingdom[10] by one Major A J Wolff DSO RE. Again by the kindness of Anne Taylor at the Cambridge University Map Library I was provided with a complete copy of the publication which contained nine pages listing co-ordinates of Primary and Secondary stations of the Principal Triangulation, calculated using Airy’s figure of the earth. This was surely the Holy Grail for, by this definition, they are therefore OSGBI 1858 co-ordinates.
And sure enough, Milk Hill appears in the list of Primary Stations on page 21 of the publication; the given co-ordinates exactly match my own calculations based on Clarke’s work:
Co-ordinates of Milk Hill given by A J Wolff, 1919:
51° 22' 32.874" North, 1° 50' 58.501" West
Original sin: Milk Hill forsaken
The one remaining question is why the original projection origin for Wiltshire - as used to construct the Whitsbury parish sheets - was abandoned before the rest of the county was surveyed from 1873. This - thankfully - is relatively easily answered thanks again to the work of Brian Adams[11].
Originally large scale maps of counties at 1:2 500 (‘25-inch’) and 1:10 560 (‘Six-inch’) were mainly plotted on sheet lines based on a projection origin within their county boundary. This meant that at the boundaries between counties there was a discontinuity in mapping, and areas spanning those boundaries could not easily be measured across. While this was largely unavoidable due to the Cassini projection’s unacceptable distortions at large scale in areas away from the central meridian, the discontinuity was already seen as problematic even in the early 1860s.
Although three pairs of Scottish counties were published together in contiguous and contiguously-numbered sheet systems in the 1850s and early 1860s, from 1865 some adjoining counties in England were published sharing the same projection origin but numbered separately - the first being Hertfordshire on the same origin as Middlesex: St Paul’s Cathedral.
Dunnose was first used as a county origin in the late 1850s for the county of Hampshire and the Isle of Wight, a range of 0.76° (175100ft) west to 0.47° (107000ft) east of the origin. It was also used from 1866 for Berkshire, from 1867 for Buckinghamshire and from 1872 for Oxfordshire. Buckinghamshire - although not bisected by the Dunnose meridian - was also published in the same sheet system, spanning from 0.06° (13900ft) to 0.72° (162800ft) east of Dunnose.
Wiltshire’s Whitsbury sheets are dated 1871 and it is likely that at this stage it was felt that the western extremity of Wiltshire was too far west of Dunnose (1.17° - 268100ft) to warrant continuing the Dunnose sheet line system into the county; this despite the mapping of Yorkshire spanning 1.48° (318000ft) west to 1.23° (267400ft) east of its projection origin at York Minster. Indeed Wiltshire was densely populated with stations of the Principal Triangulation so an accurately-measured origin internal to the county would have been readily available.
Of particular interest to me as a resident of Gloucestershire is the fact that its first County Series sheets were published just two years later in 1873 based on the Dunnose origin and sheet line system. Had the survey of the county commenced perhaps a year or two earlier it is probable that it would have been given a county origin of its own or shared one with Wiltshire. Evidently by this stage it had been accepted - at least to this degree - that the distortions of the projection in areas away from the central meridian were outweighed by the desire to maintain continuity of large-scale mapping across some county boundaries. The western tip of Gloucestershire at Avonmouth was the farthest west point used on the Dunnose sheet line system - some 1.52° (346900ft) west of the origin.
In the same year as the first County Series sheets of Gloucestershire were published - 1873 - the first sheets of Wiltshire using the Dunnose system were also published.
This is not the only occurrence of county origins being abandoned after first use in favour of neighbouring ones; indeed if you will pardon the carto-mathematical pun, there is an interesting parallel to be drawn between Wiltshire and Staffordshire. A few Staffordshire large-scale sheets covering the areas of Cannock and Stoke-on-Trent were first published from 1861 on sheet lines based on the origin of Stafford Castle, but the rest of the county was published from 1875 - also using the Dunnose system[12].
By 1883, fifteen English counties were using the Dunnose origin and sheet line system - the most easterly being Lincolnshire at 1.56° east of Dunnose at its eastern tip.
And finally: How it could have been
Taking all the data ascertained, and the numbering assigned to the original Whitsbury sheets, the map below shows in red my conjectured interpretation of the sheet layout originally planned for Wiltshire based on the Milk Hill origin. The 1:2 500 Whitsbury sheets themselves are shown to the south of Salisbury, outlined in pink. The later sheet lines used for Wiltshire based on the Dunnose origin are depicted in grey.
Points for further investigation
It is still not certain that Milk Hill was indeed the origin used for the Whitsbury sheets although it is the most likely candidate by a long way; confirmation may be contained within the records of the Ordnance Survey held at The National Archives at Kew (PRO OS 2).
References
[1] Adams, Brian, Projections and Origins, London: Charles Close Society, 2006, p63.
[2] Ibid. pp 64-5.
[3] Mudge, William & Dalby, Isaac, An Account of the... Trigonometrical Survey... 1784-1796, London: W Faden, 1799.
Mudge, William & Colby, Thomas, An Account of the Trigonometrical Survey... 1800-1809, London: W Faden, 1811.
[4] http://www.deformedweb.co.uk/trigs/images/principal_triangulation/ - diagram of Principal Triangulation stations
[5] http://www.gazetteandherald.co.uk/news/4567805.At_last__Wiltshire_s_Milk_Hill_has_summit_special/
[6] Clarke, A R, Account of the Observations and Calculations, of the Principal Triangulation; and of the Figure, Dimensions and Mean Specific Gravity of the Earth as derived therefrom, London: The Ordnance Trigonometrical Survey of Great Britain and Ireland, 1858, pp 28, 723-8.
[7] Seymour, W A, A History of the Ordnance Survey, Folkestone: Wm Dawson & Sons Ltd, 1980, p143; available online at:
http://www.ordnancesurvey.co.uk/oswebsite/docs/ebooks/a-history-of-the-ordnance-survey/index.html
[8] http://books.google.co.uk/books?id=H2gD6s3n8ZgC Retrieved 23/03/2012
[9] http://www.movable-type.co.uk/scripts/latlong-vincenty-direct.html Retrieved 28/03/2012
[10] Wolff, A J, The Mathematical Basis of the Ordnance Maps of Great Britain, Ordnance Survey, 1919.
[11] Projections and Origins, pp 66-8.
[12] Ibid. pp 77-8.
Acknowledgements
With grateful thanks to:
- Alex Zambellas for finding these anomalous sheets in the first place;
- Roger Hellyer for informing me of their existence and for information from the early stages of the Principal Triangulation;
- Nick Millea at the Bodleian Library for being so accommodating of my requests for viewing maps; and
- Anne Taylor at the Cambridge University Map Library for her information from Clarke’s 1858 book and Wolff’s 1919 pamphlet.
Page last updated: 6 November 2015